Chapter 2 Pac-Man Plot
2.1 Description
2.2 Usage
The function is setup to implement an arbitrary regression model and supports residual standardization. As we have discussed above,
2.3 Examples
For the following examples, the domain and range that will be processed by the function will be:
data("cars")
x <- cars$dist
y <- cars$speed

pac.plot(cars$speed,cars$dist, 'Example 1', c("Distance", "m"), c("Speed", "m/s"))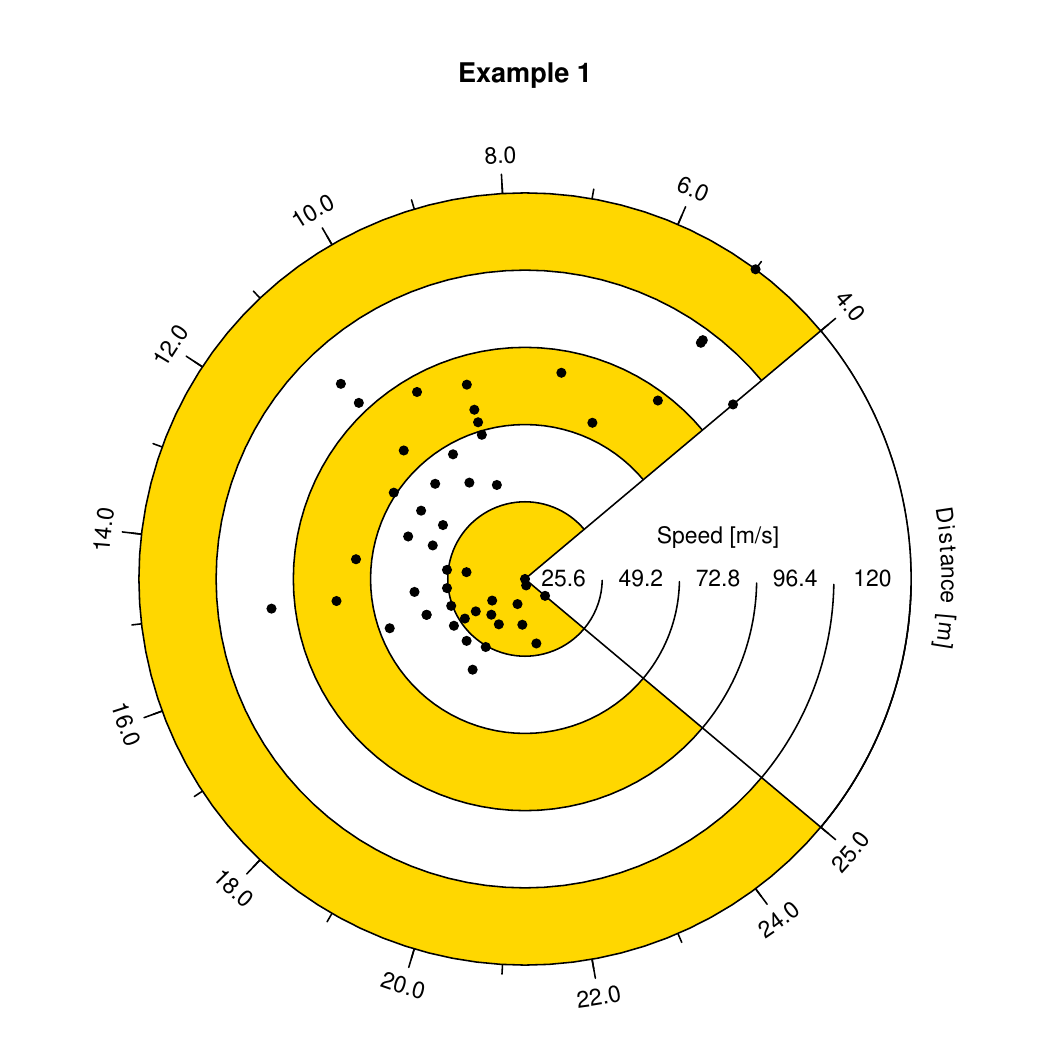
Figure 2.1: Graphical result of Example 1. A basic example of how the relationship between the speed and distance of the car can be visualized.